 2.2.1 Dispersion time and Power selection
"Polymers and Surfactants as Dispersing Agents for Zinc Oxide and Titanium Dioxide"
Vadim Knobel (SMS)
Table of Contents
1. Abstract
2. Introduction
Experimental
3. Sample Preparation
Experiments
Particle Size
Particle Stability
Adsorption Isotherm
Conclusions
Appendix I
Appendix II
References
Abstract
The author(s) studied the adsorption of low molecular weight polyacrylic and polymethacrylic acids and of the surfactant SDS, on the surface of ZnO and Titanium Dioxide. The size of oxide aggregates in aqueous solution, the pH of the solutions and also the electrophoretic mobility of the aggregates formed were studied as a function of polymer and surfactant concentrations and of the oxide concentration. Various methods were tried in the generation of adsorption isotherms for the polyacrylic and polymethacrylic acids, the method of choice was TOC (Total Organic Carbon Analysis). It was found that the most stable and smallest-sized dispersion is formed when a fraction high enough so that significant friction occus between the oxide aggregates of ZnO is combined with a concentration of PAA just high enough to disperse it. It was found that on per-weight basis low molecular weight polymers provide higher surface coverage, and increased stability which translates into lower average colloidal size.
1. Introduction
Zinc Oxide and Titanium Dioxide dispersions are mostly used in the production of paint pigment, dental cement, diaper rash cream, and sunscreen. In sunscreen preparation ZnO and Titanium Dioxide are used in concentrations of 2-25% and provide protection over all bands of the UV spectrum, including the UV-A range, which is thought to cause aging damage.
Zinc Oxide and Titanium Dioxide colloidal dispersions have a high tendency to agglomerate in solution due to the nature of attractive London van der Waals between the metal oxide particles. It is possible to prevent this agglomeration in two ways: by maximizing the electrostatic repulsion force between the charged particles, and by providing a barrier of steric hindrance. The maximization of the particle’s charge occurs when small highly charged molecules are adsorbed on the surface of the colloid and the steric barrier is typically established when larger molecules (such as polyelectrolytes, surfactants) are adsorbed on the surface of the particle. Polymer molecular weight plays a role in stabilizing dispersions, m.w. 5000 paa disperses a ceratin Alumina sample, while, m.w. 50,000 flocculates, the dispersion. When polymer is adsorbed on the oxide surface, the charge of the particles decreses at high dosages charge reversal ovccutrs. cooh group can either be a proton donor or acceptor and therefore can adsorb due to hydrogen bonding between cooh's and surface -oh2+'s (Das).
The goal of the study was to compare the effects and low molecular weight polyacrylic and polymethacrylic acid salts, and of the anionic surfactant SDS (sodium dodecyl sulfate), on the stability and average particle sizes in solution. Common variables such as pH, conductivity, Zeta-Potential, and concentrations of metal oxides and polymers were also experimented with keeping in mind the size of particles in the dispersion and its stability.
Much research has been done on studying the adsorption of polymers and surfactants on metal oxides. However the colloid of choice is often Aluminum oxide (Ho, Forshey) which has different physical and chemical properties from Zinc Oxide and Titanium Dioxide. Measurement of the particle size of aggregates and of the amount of polymer or surfactant adsorbed should give us a clue about the process of dispersion. This study assumes that polymers and surfactants are not equally good at dispersing the aggregates and their effectiveness depends on factors such as molecular weight and surface charge. The measurements of polymer adsorption in this series of experiments were carried out by the TOC – total organic carbon analysis. We found that it is easy to measure the cocnetration of polymer in supernatant at cocnetrations higher than about 0.005%, below that concentration it might be necessary to use another method or technique. We tried also to use the following methods to perform adsorption measuremtns of polymer: Spectroscopy, TGA (thermo-gravimetric analysis), precipitation of polymer with acids and salts, conductivity measurements, The concentrations of anionic SDS were measured by potentiometric titrations (Vermohlen) with the cationic surfactant CTAB. For the determination of polymer concentration spectroscy did not appear to give a consistent peak for the polymers PAA nor PMA in the range of 190 to 900 nm, TGA was not sensistive enough to measure the amount of polymer in solution which was in the range of 0.001% to 1%, conductivity could not be used because the resolution was not sensitive enough to measure the difference between two close polymer concetrations. Precipitation of polymer theoretically appeared to work if the polymer concetration was high enough so that when it is precipitated it forms a large enough pelllet to be easilty isoltated and weighed. For a 15-ml sample of solution the amount of polymer therefore had to be about 0.1% to give a pellet fo 15 milligrams. TOC turned out to be the most sensitive method giving consistent reading of carbon contrations above 15 ppm, or polymer concetrations above about 50 ppm (.005%). It was not possible to measure samples for adsoprtion where the polymer concetration was lower than that, for those samples another method or procedure has to be used.
2. Experimental
2.1 Sample Preparation
The ZnO used in the preparation of samples was Nanox brand ZnO available from Rheox Inc. (Highstown, NJ). DAXAD-30 is a 25% solution of polymethacrylic acid salt in water, manufactured by Hampshire Chemical Corporation in Owensboro, KY. The sodium salts of polyacrylic acid - PAA (molecular weights 2100, 6000) in solid form are available from Scientific Polymers Products Inc. (Ontario, NY). The polymethacrylic acid salt- PMA (molecular weight 6500, 9500) is available in solution (30% and 25%) from Aldrich Chemical Co. Inc. Milwaukee, WI.
Usually the preparation of dispersions is divided into three concrete steps: wetting, milling/physical dispersion, and stabilization. However in particle size measurements in this report it was found that there is no obvious difference in combining these steps into one and some practical difficulty in dispersing the ZnO and Titanium Dioxide is avoided if the solid is wetted with stabilizing solution of polymers or surfactants before physical dispersion (with a powerful homogenizer).
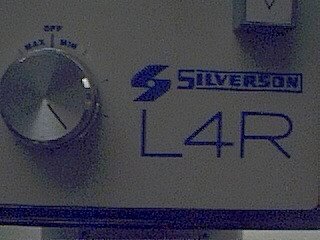
Samples of the Zinc Oxide with PAA-2100, PAA-6000, PMA-6500, PMA-9500 were manufactured in the following way: first polymer or surfactant was dissolved in water in one of the relevant concentrations (the concentration range for PMA-9500 dispersions for example was 0.0001% to 5% including 0.0001%, 0.0002%, 0.0005%, 0.001%, 0.002%, 0.005%, 0.01%, 0.02%, 0.05%, 0.1%, 0.2%, 0.5%, 1%, 2%, 5%) and the relevant amount of zinc oxide (typically 1% for most experiments but 0.1% to 70% for the study of the effects of ZnO concentration on the average particle size) or 1% TiO2. All the dispersions were made in batches of 100 grams. Typically after the polymer/surfactant solution was combined with zinc/titanium oxide vigorous shaking was preformed followed by more thorough physical dispersion with a homogenizer Silverson L4R. The power setting of the homogenizer was typically "4" but varied between 1 and 9 for experiments in which the effect of power on the dispersion size was measured. The dispersion time was typically 15 minutes but also varied between 30 seconds and 2 hours for the experiments in which the effect of homogenization time was measured.
After homogenization the sample were stored in 125-ml Nalgene LDPE bottles until particle size and other measurements could be performed. Before measuring particle size measurements it was often useful to redisperse the sedimented ZnO or Titanium Dioxide in the bottle by vigorous shaking. The particle size measurements were carried out with two separate light measuring apparatuses using separate methods but with very similar results (which were verified by optical microscopy). The first size measurements were performed with the Brookhaven BI-90 light measuring apparatus which uses DLS (dynamic light scattering) to measure the particle size. The other apparatus was the Malvern Mastersizer which correlated the measured index of refraction with particle size. The two instruments compliment each other because the most sensitive range for the Malvern is in the one micron or more size, while Brookhaven BI-90 does not give accurate reading for particle larger than about 3000 nm. When measuring particle size at least three separate measurements were made for each data point, and then the average was used.
2.2 Particle Size Experiments
2.2.1 Dispersion time and Power selection
Samples were prepared in the regular way (see 2.1) and dispersed with 0.2% PAA 2100 for 15 minutes at various power setting from 1 to 9. Also samples were again prepared with 0.2% PAA 2100 and dispersed at the homogenizer power setting of "4" for the timer intervals: 30 seconds, 1 minute, 2 minutes, 5 minutes, 10 minutes, 15 minutes, 30 minutes, 60 minutes and 120 minutes. The particle size was then measured with the BI-90.
2.2.2 Polymer Concentration selection
The size of particles dispersed with each of the five polymers in the concentration of 0.01 to 1%. After no significant size difference was observed the polymer concentration were reduced and new samples were prepared in the concentration of 0.0001% to 0.005%, and also without any polymer.
2.2.3 ZnO concentration selection
Even though the active concentration of ZnO and Titanium Dioxide in sunscreen preparation is typically 2-25% samples with ZnO concentration of 0.1%, 0.2%, 0.5%, 1%, 2%, 5%, 10%, and 20% were prepared with PAA 2100 concentration of 0.1%, 0.2%, 0.5%. Also to observe the full range of possible particle size in response to ZnO concentration 0.5% paa 2100 was used in conjunction with 30%, 50%, 60% and 70% ZnO and 0.2% paa 2100 was made with 30% ZnO.
2.2.4 Titanium Dioxide particle size
One percent of Titanium Dioxide was prepared in the same way as ZnO, with 0.2% PAA 2100. The size was measure din the usual way.
2.2.5 SDS – dispersed ZnO
Samples of 1% ZnO were prepared in the standard way with the following SDS concentrations: 0.031%, 0.05%, 0.1%, 0.2%, 0.5%, 1% and 2%. The samples were then measured with the BI-90.
2.3 Particle Stability
The polymer PMA-9500 was selected for this experiment because at produced large aggregates at a higher concentration (0.01%) then any other polymer and therefore appeared to have less stabilizing effect on the ZnO. The standard 1% of ZnO was used for all samples in this experiment. Three concentrations of PMA-9500 polymer were used a low concentration of 0.014%, a medium concentration of 0.025%, and a high concentration of 2%. The samples were stored at room temperature in LDPE bottle and before each measurement the sedimented ZnO would be vigorously shaken for an equal amount of time in order to redistribute the solid. The dispersions were then measured with the BI-90. The total length of the experiment was two weeks (approximately 300 hours). In the results section the best linear fit for the change in size with time is given a correlation (0 to 1) which is a good indication whether the fit applies or not, that is whether there is actually a change in size with time or the change is due to error and variation in the measurements.
Th e change in the particle’s electrophoretic mobility was also done with a Zetameter 3.0+ by Zeta-Meter Inc. of Stanton VA. The electrophoretic mobility is a measurement of surface charge on the particles and often corresponds to a particle’s tendency to agglomerate in solution.
 2.4 Adsorption Isotherms
2.4.1 TOC
Total Organic Carbon analysis is a method of indirectly measuring the polymer amount adsorbed by measuring the amount of carbon in solution. The Total Organic Carbon Analysis was preformed using the TOC 5000-A made by Shimadzu of Kyoto, Japan.. TOC oxidizes the sample and measure the peak of CO2 in the infrared region. The samples for the TOC were prepared from the dispersions used in the particle size experiments. The dispersions were centrifuged at 4000 rpm for 30 minutes, until all the visible solids precipitated. The supernatant from the dispersions was then stored in glass vials until use. About 0.1 ml of ultrapure (<<1 ppm Carbon) HCl was added to the supernatant in order to reduce the amount of dissolved CO2 in the solutions. The supernatant was vigorously shaking before the measurement to release any dissolved
CO2. For each polymer concentration measurements a calibration curve was constructed using the same polymer, dissolved in water in known amounts. The measurements are automatically performed by the TOC machine and are repeated until measurements of the same sample have a S.D. of less than 2%. At time it was necessary to dilute the samples by a known amount (typically 10X) in order for the TOC to obtain a measurement in a range that is valid.
2.4.2 Titration
Similarly to the procedure described above the supernatant was isolated from the prepared dispersions, about 1 ml of the indicator DBDB was added, and the sample was covered over with chloroform. The sample was then shaken vigorously and weighed. The sample with SDS was titrated with CTAB of approximately equivalent concentration until the color of the indicator changed to clear. The amount of CTAB necessary was calculated from the weight change of the sample.

3 Results and Discussions
3.1 Particle Size Experiments
3.1.1 Dispersion Time and Power Selection
 Figures 1 and 2 show the effects of increasing the power and the speed of homogenization. The increase in power from 0 (no homogenization) to the power setting of 1 (include photo) account for a 25% drop in size, increasing the power to 9 (maximum) provides for a 35% drop in size. The setting used to prepare all the following samples will be 4, because it provide good reduction in size while consuming only a moderate amount of power. Changing the time of homogenization from 0 minutes to 2 minutes results in a 28% reduction in size, increasing the time to two hours results in a 37% reduction in size.
It seems that homogenization for 2 minutes would provide most of the effect in reducing the particle size, but due to time limitation for the rest of the experiments the time for dispersion was 15 minutes.
 3.1.2 Polymer Concentration Selection
In the first series of experiments on the change of average particle size with polymer concentration, concentrations between 0.01% and 1% were analyzed. The average particle size reading with 1% ZnO and the polymers was in the range of 330 to 280 nm, with pma 9500 giving the highest particle size at 0.01%. To further see the entire spectrum of particle size change the particle size range was extended down to 0.0001%, the particle size is shown in Figure 3. The full range of polymer concentrations is on the x-axis the inset is a magnification of the range of polymers 0.001 to 10% and the y-axis on the inset has been reduced to show the differences in particle size more clearly.
 There are three main regions in Figure 3. The first region is in the polymer conctration of 0.0001% to about 0.002% , the average size of aggregate sin this region is 3 to 5 microns. At this size the aggregates were readily observable with a light microscope at 100X and 500X. The polymer at this low concentration does not appear to have a stabilizing effect on the ZnO, but neither does it have a flocculating effect. It is well known that a low concentration of polymer can flocculate a colloid and cause it to rapidly sediment out of solution, but it appears that our low molecular weight PAA and PMA salts do not cause either flocculation or stabilization in the range of about 0.0001% to 0.002% (1 to 20 ppm).
The second interesting region in Figure three is in the polymer range of 0.002% to 0.01%. In this region the stabilizing effects of polymers first appear. Notice that at the concentration of 0.005% the average size of the particles varies greatly. The highest particle size of over 1000 nm is observed with the dispersant PMA-9500, while the smallest aggregate size is with PAA 2100. However, when the particle size is correlated to the molarity of the polymer in solution, PAA 2100 makes for the worst-dispersing polymer, at at molarity of about 3 microMoles the average size of aggregates dispersed with PAA 2100 is over 400 nm, while with the other polymers the average particle size is less than 350 nm. If the polymer is thought of as a long slab than can adsorb flatly on the colloidal particle and form a "bumper" which will prevent the particle from agglomerating with another particle then an equal weight of the same polymer despite its molecular weight should give the same agglomeration protection. However if the polymer is though of as a three-dimensional coil then a higher molecular weight polymer will more likely prevent the agglomeration of particles as it occupies more volume than a low molecular weight polymer.
3.1.3 ZnO concentration selection
The graph on the right shows the aggregate size of Zinc Oxide dispersed with three polymers. The Zinc Oxide concentration is from 0.1% to 70% and the polymer (PAA 2100) concentration is 0.1%, 0.2%, 0.5%.
For the lowest polymer Concentration (0.1%) a steady increase in size from 260 to 300 nm is observed as the ZnO concentration is increased from 0.1% to 1%, from 1% to 100% the size decreases from 300 to 270 nm, and from 10% to 20% the size rapidly increases from 300 to 3000 nm.
The particle size profiles are similar for other polymer concentrations. It appears that at the lowest concentrations, during the dispersing process the particles have a lower tendency to aggregate, being in a dilute solution. However, as the particle concentration increases the particles aggregate more and the average size increases. Also, as the concentration is increased to high values (1% and more) the extra friction generated by the homogenization process leads to a size decrease until a critical point, after which the size increases rapidly as there is no longer enough polymer to effectively disperse the aggregates. This is also seen in the adsorption isotherm for various amounts of zinc oxde and constant polymer concentration in 3.3.1.
3.1.4 TiO2 Particle Size
 The average aggregate size of the tio2 particle dispersed with paa 2100 seems to not be affected by the polymer. It is likely that paa-2100 does not adsorb strongly enough to the surface of the alumina and silica coated titanium dioxide and does not aid in its dispersion. Alumina is generally though to adsorbed paa easily at low pH’s however at high pH’s such as produced when the sodium salt of PAA is dissolved in water (pH 9-10) the adsorption is minimal as the alumina that coats the surface of the titanium oxide is close or above its isoelectric point.
3.1.5 SDS Concentration and Particle Size
As the amount of SDS in solution with Zinc Oxide eis increased the size of the aggregates falls from 4000 nm to 700-800 nm. The size reduction is not so strong as with Zinc Oxide it is likely that the anionic SDS does not have the same effectiveness in prevent agglomeration as polymer. SDS has a much lower molecular weight and a smaller size that would not make it into an effective steric barrier between the agglomeration of two zinc oxide particles, even though it does form micelles at the higher concentrations that form a perhaps weak steric barrier against agglomeration.
 3.2 Particle Stability
3.2.1 Stability over Time
In this experiments the average particle size was measured over two weeks. Before each measurement was taken the solutions were thoroughly shaken for about 30 seconds, to break up the sediment.
Even though dues to its high density zinc oxide sediments over time the particle size of the aggregate is stable over time if the zinc oxide is dispersed with a moderate concentration (0.025%) or a high concentration (2%) of polymer.
However, when a low concentration of polymer (0.014% of PMA 9500) is used the average particle size in solution decreases. This can be explained by the higher tendency of larger particle to aggregate in sediment that cannot be broken up due to their strong bonds, and that is too large to be counted in the particle size measurements by the BI-90.

3.2.2 Zeta Potential and Polymer Concentration
A Zeta potential of between –20mv and +20mV typical implies that the particles do not carry enough charge to repel each other and are more likely to aggregate. Such measurements are found at the lower polymer concentrations in the figure on the right. As the concentration of polymer is increased, so does the electrophoretic mobility becomes more negative. However it is interesting to note that some of the particles at the lowest polymer concentrations (0.001%) are positive while others are negative. Pure zinc oxide prepared without any polymer is a moderately electropositive particle with an average Zeta-Potential of 35 to 39 mV. It is not known what can be inferred further from the zeta potential except that at moderate polymer concentrations (0.005%-0.01% and higher) in this experiment the particle are moderately electronegative and therefore in addition to the steric forces that prevents them from aggregating in solution are also under the influence of electrostatic forces due to adsorbed polymer.
3.2.3 Zeta Potential Titanium Dioxide
The graph on the right shows the change in the electrophoretic mobility of silica and alumina coated titanium dioxide as more paa 2100 is added into the dispersion. The electrophoretic mobility is quiet low from the starting value at 0.002% polymer. As the polymer concentration is raised the zeta-potential decreases to the lowest value of about –70. If we correlate this chart with the chart of TiO2 particle size (see 3.1.4.) then we see that even though the electrophoretic mobility is lowered the particle size still remains stable in the range of 700-800 nm. Perhaps titanium dioxide is already well dispersed at this polymer concentration, but the aggregates have a higher average size than zinc oxide aggregates. Also it is possible that no polymer is adsorbed on the titanium dioxide.
3.3 Adsorption Isotherms
3.3.1 TOC - Polymer Adsorption
Total organic carbon analysis is effective in measuring carbon concentrations of over 15 ppm (equivalent to about 0.005% of polymer per sample). TOC was used to measure the amount of polymer in the supernatant of the dispersions prepared in 3.1.2 and 3.1.3. The samples that could be measured with TOC had concentrations from 0.005% polymer to 0.5% polymer. In cases where the polymer concentrations was higher than 0.1% the samples had to be diluted with distilled water in order to be properly measured. The top isotherm on this page shows the amount of polymer that was measured to be adsorbed vs. the polymer concentration in the dispersion prior to adsorption. The amount adsorbed typically increases as the polymer concentration increases from 0.005% to 0.02%, from 0.02% to 0.2% the isotherms tend to level off, but then for the value of 0.5% polymer the adsorbed concentration is always higher than would be expected had the isotherm levelled off completely (for more details see appendix 2). The graph on top left is a magnification of the isotherm with values ranging from 0.005% to 0.2%, the points are fitted using the Freundlich equation (Amount Adsorbed=K*[Initial Concentration]^t), which is a good model for single layer adsorption. Polymer adsorption is generally assumed to be single layer, even though it is often more complicated and depends on parameters such as ionic strength and pH which change the conformation of the adsorbed polymers and allow for more complicated adsorption isotherms. There are several conclusions that are apparent from the adsorption isotherms above. Pma 9500, the highest molecular weight polymer is adsorbed the most, likely due to it high molecular weight it likely extends in to the solution from the surface of the aggregate and doesn’t adsorb flat. The next strongest adsorbing polymer is paa 2100, which is the best dispersing polymer. The adsorption of pma-6500 seems to be flat in the region of 0.02 to 0.2%, which would constitute the plateau region of adsorption for this polymer. Generally all the polymers adsorb in approximately the same amount (see Appendix 2) it is even possible to average out the adsorption of all the polymers and see for example that at 0.1% polymer about 0.01 grams (10 milligrams) are adsorbed per 1 gram of zinc oxide. If the value of 17 m^2 (the value given by the manufacturer) is used for the surface area of zinc oxide then at 0.1% polymer the surface density of polymer is about 0.6 mg/m^2.
When the amount of polymer adsorbed (as a percentage of total polymers in solution) is graphed vs. the zinc concentration in the dispersion the amount approaches 100% in the graph on the previous page. This shows that polymer adsorption is most efficient at high particle concentration, but a higher fraction of polymer is adsorbed when its concentration is low.
3.3.2 Titrations - SDS Adsorption
SDS adsorption of the solutions from 3.1.5 was measured using potentiometric titration with the cationic surfactant CTAB. In the graph on the left we see that for the same concentration (0.2% for example) more SDS is adsorbed to the zinc oxide than polymer (see 3.3.1), however the particle size of aggregates dispersed with SDS is still much higher (see 3.1.5). The amount adsorbed fits the Freundlich curve, very well implying a single-layer adsorption.
 3.4 pH and Polymer concentration
In the graphs above the conductivity and pH of solutions with polymer are shown. As the amount of polymer increases so does the pH, until it plateaus around 95 to 10, while the conductivity is constantly increasing. The plateau corresponds also to the
region of the isoelectric point of zinc, indicating that in this region there is no electrostatic interaction between the zinc oxide particles and the polymer and therefore adsorption should too level out. In the pH graph above it seems that zinc in solution (dissolved) causes the pH to be suppressed when the polymer concentration is increased, while when polymer is added to water without any zinc the pH rises immediately. Therefore in addition to adsorption zinc oxide also undergoes some acid-base reaction with sodium polymethacrylate in solution.
At pH lower than ZnO isoelecric point, electrostatic forces cause adsorption, also polymer confirmation in solution plays a role. At high pH unfavorable electrical repulsion should prevent adsorption, The adsorption is strongly dependent on the acid/base character of the pigment surface, which is governed by the isoelectric point of the pigment surface and the pH of the medium. At low pH for Al2O3 the high level of adsorption results from a low solubility due to the low degree of ionization of the COOH and from the collapsed polymer confirmation. At high pH polymeric acids adsorb from alkaline medium because of acid base or hydrogen bonding interaction with the MO surface (Chen).
Conclusions
There are several conclusions that can be reached about the preparation of zinc oxide and titanium dioxide dispersions with polymers and surfactant. First, increasing deaglomeration power or time makes a small difference in the particle size while using polymers/surfactants significantly decreases aggregate size in the dispersion. The effects of steric hindrance from the adsorbed molecules are very effective in preventing agglomeration. Also, an optimum concentration of polymer exists, for example 1% ZnO the optimum concentration is in the region of 0.02% to 0.5% at lower concentration zinc oxide surface coverage is likely to low to prevent agglomeration, while at higher concentrations the polymer likely causes a higher amount of agglomeration by pushing the zinc oxide out of solution or possibly by changing the viscosity properties of the dispersions so that during dispersion the friction that breaks up the agglomerates is reduced. Processing a high concentration of ZnO with enough polymer (0.2%) gives the best results. Generally polymers differ in their effectiveness. PAA and PMA make a smaller size dispersion than SDS, due to increased steric effects, and higher charge concentration.
Appendix I
Data Verification – BI-90
Much data presented in this report concerning the particle size of the colloidal dispersions has been generated with the Brookhaven BI-90 Dynamic light scattering particle-sizer. In order to verify the validity of the data it was established that the particle size, particle polydispersity (width of size distribution), and particle concentration are independent factors.

 Two solutions were used in the measurements a 2% PMMA and 0.014% PMMA (mw 9500) solution, each with 1% ZnO in water. The samples were prepared in the standard way and in the comparison below many measurements were taken of the same sample, but each time a measurement was taken a different amount of solution was put in to the cuvette and diluted with water (as to do the particle sizing) in order to test the dependence of particle size and polydispersity on the count rate.
The scatter graphs were produced on Microsoft Excel and fitted using a linear fit; the R-squared value measures the correlation between the variable on the x-axis and y-axis. A correlation below 0.1 is considered negligible, 0.2 to 0.4 is a weak correlation, 0.4 to 0.7 is moderate correlation, and above 0.7 it is considered strong.
All the values are below 0.1, showing that there is no correlation between particle size, polydispersity and concentration.
Data Verification – TOC
 It was tested whether the amount of time and the power of centrifuging affect the measured amount of polymer in the supernatant. The results show that the difference in polymer concentration in solution is a maximum of 2% (691 vs. 708 ppm), and is not greatly affected by either the speed of centrifugation nor the duration of centrifugation (the error in measurements as measured by the TOC was a maximum of 0.4%, but an error of 1.0% was observed when repeat measurements of the same samples was made).
Appendix 2 – Polymer Adsorption Isotherms (Freundlich Fits)
 There are several interesting features on the adsorption isotherm fits on this page. The adsorption of pma 6500 is flat (the plateau region) at most of its concentration range, the adsorption of pma 9500 shows the most adsorption over the range of less than 0.2%, and the other molecular weight polymers are similar in their adsorbed amounts. The isotherm on the right is a Freundlich fit of the averages of adsorption for all polymers and gives an estimate on whether a particular polymer is above or below the average.
Acknowledgements
Thank you to my mentor - Yonghui Yuan, Ritu Verma, Jim Loderstedt, Ki Chan, Srividya Ramakrishnan, Joe Moschetto, Deborah Rick, Isabella Goldmints, Art Love, Lei Zhang – Columbia University, Richard Chalmers, and every intern and scientist that helped me complete my research project during the summer of 2001.
References
Kokufuta, E.. Fujii, S., Hirai, Y., Nakamura, I., " Study on adsorption of nonionic and cationic polymers on silica gel by using total organic carbon analysis" Polymer, 1982 Vol 23, March
‘How Polyelectrolytes Behave at Solid Surfaces" a Ph. D. thesis by Mats A. G. Dahlgren – Royal Institute of Technology, Stockholm, Sweden (1996)
Das, K. K., Somasundaran, P. "Ultra-low dosage flocculation of alumina using polyacrylic acid" colloids and Surfaces A: Physicochemical and Engineering Aspects 182 (2001) 25-33
Chen, M., Elliott, P., Glass, J. E., Influences of monomer and oligomer structures on their adsorption on metal oxide surfaces. Colloids and Surfaces A: Physicochemical and Engineering Aspects 183-185 (2001) 457-474
Stubbs, J. M., Durant, Y. G., Sundberg, D. C., Competetive Adsorption of Sodium Dodecyl Sulfate on Two Polymer Surfaces within Latex Blends. Langmuir 15 (1999) 3250-3255
Esumi, K., Fujimoto, N., Torigoe, K., Simultaneous Adsorption of Poly(amidoamine) Dendrimers with Surface Carboxyl Groups and Sodium Dodecyl Sulfate at the Alumina/Water Interface. Langmuir 15 (1999) 4613-4616
Dobrynin A. V., Deshkovski A., Rubinstein M., Adsorption of Polyelectrolytes at Oppositely Charged Surfaces. Macromolecules 34 (2001) 3421-3436
Dobrynin A. V., Deshkovski A., Rubinstein M., Structure of Adsorbed Polyampholytes Layers at Charged Objects. Macromolecules 34 (2001) 627-639
Hoogeveen N. G., Cohen Stuart M. A., Fleer G. J., Polyelectrolyte Adsorption on Oxides I. Kinetics and Adsorbed Amounts. Journal of Colloid and Interface Science 182 (1996) 133-145
Hoogeveen N. G., Cohen Stuart M. A., Fleer G. J., Polyelectrolyte Adsorption on Oxides II. Reversibility and Exchange. Journal of Colloid and Interface Science 182 (1996) 146-157
Okubo T., Suda M., Adsorption of Polyelectrolytes on Colloidal Surfaces as Studied by Electrophoretic and Dynamic Light-Scattering techniques. Journal of Colloid and Interface Science 213 (1999) 565-571
Schweins R., Huber K., Collapse of sodium polyacrylate chains in calcium salt solutions. The European Physical Journal E 5 (2001) 117-126
Santhiya D., Subramanian S., Natarajan K. A., Malghan S. G., Surface chemical studies on alumina suspensions using ammonium poly(methacrylate). Colloids and Surfaces A: Physicochemical and Engineering Aspects 164 (2000) 143-154
Das K. K., Somasundaran P., Ultra-low dosage flocculation of alumina using polyacrylic acid. Colloids and Surfaces A: Physicochemical and Engineering Aspects 182 (2001) 25-33
Vermohlen K., Lewandowski H., Narres H.-D., Schwuger M. J., Adsorption of polyelectrolytes onto oxides - the influence of ionic strength, molar mass, and Ca2+ ions. Colloids and Surfaces A: Physicochemical and Engineering Aspects 163 (2000) 45-53
Boisvert J.-P., Persello J., Castaing J.-C., Cabane B., Dispersion of alumina-coated TiO2 particle by adsorption of sodium polyacrylate. Colloids and Surfaces A: Physicochemical and Engineering Aspects 178 (2001) 178-198
Gebhardt J. E., Fuerstenau D. W., Adsorption of polyacrylic acid at oxide/water interfaces. Colloids and Surfaces, 7 (1983) 221-231
Strauss H., Heegn H., Strienitz I., Effect of PAA adsorption on stability and rheology of TiO2 dispersions. Chemical Engineering Science 48:2 (1993) 323-332
ed. Tardos T. F., Solid/Liquid Dispersions
Academic Press, New York 1987.
Yu X., Somasundaran P., Structure of sodium dodecyl sulfate and polyacrylic acid adsorption layer using nitroxide spin labeled alumina. Langmuir 16:7 (2000) 3506-3508
Herzig M., Knoche W., Kinetics of Protonation of Polymethacrylic Acid in Aqeous Solution. Journal of Physical Chemistry A 102 (1998) 1304-1308
Forshey P. A., Turan T. S., Lemmo J. S., Cutie S. S., Pytynia D. L., Analysis of sodium polyacrylate absorbent dust using ultra-trace sodium analysis – a 7-company collaborative study. Analytica Chimica Acta 298:3 (1994) 351-361
Dabros T., van de Ven T. G. M., A direct method for studying particle deposition onto solid surfaces. Colloid and Polymer Science 261 (1983) 694-707
Kimura K., Dispersibility of zinc nanoparticles in organic liquids as proved by ESR measurement. Journal of Colloid and Interface Science 183:2 (1996) 607-609
Ho B. C., Lee Y. D., Chin W. K., Thermal Degradation of Polymethacrylic Acid. Journal of Polymer Science part A – Polymer Chemistry 30:11 (1992) 2389-2397
Heitz F. J., Mestdagh M. M., Spectroscopic study (uv-visible and electron paramagnetic resonance) of the interactions between synthetic polycarboxylates and copper ions. Polymer 38:21 (1997) 5321-5332
Fan A., Somasundaran P., Turro N. J., Role of sequential adsorption of polymer/surfactant mixtures and their confirmation in dispersion/flocculation of alumina. Colloids and Surfaces A: Physicochemical and Engineering Aspects 146 (1999) 397-403
Giles C. H., MacEwan T. H., Nakhwa S. N., Smith D., Studies in Adsorption. Part XI. A System of Classification of Solution Adsorption Isotherms, and its Use in Diagnosis of Adsorption Mechanisms of Specific Surface Areas of Solids. (1960) 3973-3993
Soga I., Granick S., Segmental orientations of trains versus loops and tails: the adsorbed polymethylmethacrylate system when the surface coverage is incomplete. Colloids and Surfaces A: Physicochemical and Engineering Aspects 170 (2000) 113-117
Fairhurst D., Mitchnick M. A., Particulate Sun Blocks: General Principles
SunSmart Inc, Wainscott, NY.